Supply Curve
As discussed, supply is the number or quantity of goods or service available for purchase or consumption within a market or economy.
The supply curve refers to a graph showcasing the relationship between the cost of a product or service (Price), and its supply for a specific period of time (Quantity Supplied).
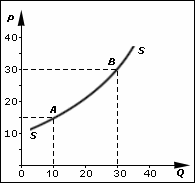
- Notice that the supply curve always slopes upward. This is because producers are willing and able to produce more of a product or service if the price paid for that product or service is higher.
When allocating points in a graph, the vertical axis represents the price, while the horizontal axis represents the quantity supplied.
The supply curve has two variables concerning production of a good – quantity and price.
The supply curve moves in an upward direction from left to right. This is also referred to as the law of supply.
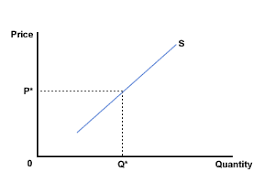
With the increase in the price of a product, its supply also increases, provided all other things remain constant.
Here, the price remains to be independent, while the quantity stays dependent.
Usually, the independent attribute is positioned on the horizontal axis, which tends to exceptional in this case.
Factors Affecting the Supply Curve
Supply curves routinely shift based upon changes in the market. That is, the amount that producers are willing and able to supply at a given price may increase or decrease.
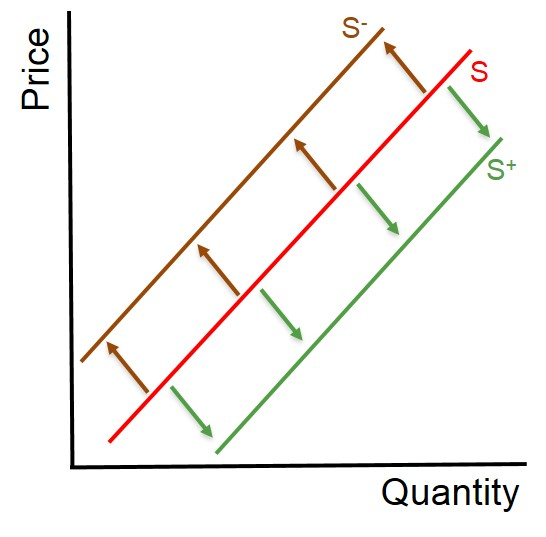
An increase in the production costs, for any reason, may reduce the willingness or ability to produce a given quantity.
This is irrespective of the price remaining constant, will lead to the supply curve shifting to the left.
A reduction in production costs will generally lead to an increase in the quantity produced, thus shifting the curve to the right.
There are many other variables that can shift the supply curve from its initial position. Common variables include:
- access to resources,
- new technology,
- labor supply,
- regulations,
- substitute products,
- overall market expectations,
- level of competition in the market.
For substitute products, if the price of a substitute good increases, the producer will be more tempted to produce it, which will negatively affect the production of the original product. This will result in lower production levels and curve will shift to the left shift.
In summary, other variables can also result in the right shifting of the supply curve.